xDebug & PhpStorm (Docker)
This guide helps you set up xDebug inside a Docker container with PhpStorm for local debugging.
⚠️ Note: If you're using the default Docker setup from
make up, xDebug is already installed and configured.
⚙️ xDebug PHP Configuration
Ensure xdebug is installed in your Docker image. Inside Dockerfile:
RUN pecl install xdebug && docker-php-ext-enable xdebug
In your php.ini (or custom config loaded in Docker):
zend_extension=xdebug.so
xdebug.mode=debug
xdebug.start_with_request=yes
xdebug.client_host=host.docker.internal
xdebug.client_port=9003
🔧 Port
9003is the default PhpStorm debugger port.
🐳 docker-compose.yml
Ensure the following settings are present:
services:
  app:
    environment:
      PHP_IDE_CONFIG: "serverName=app"
      XDEBUG_MODE: "debug"
      XDEBUG_CONFIG: "client_host=host.docker.internal"
    volumes:
      - ./:/var/www/html
🧐 PhpStorm Configuration
-
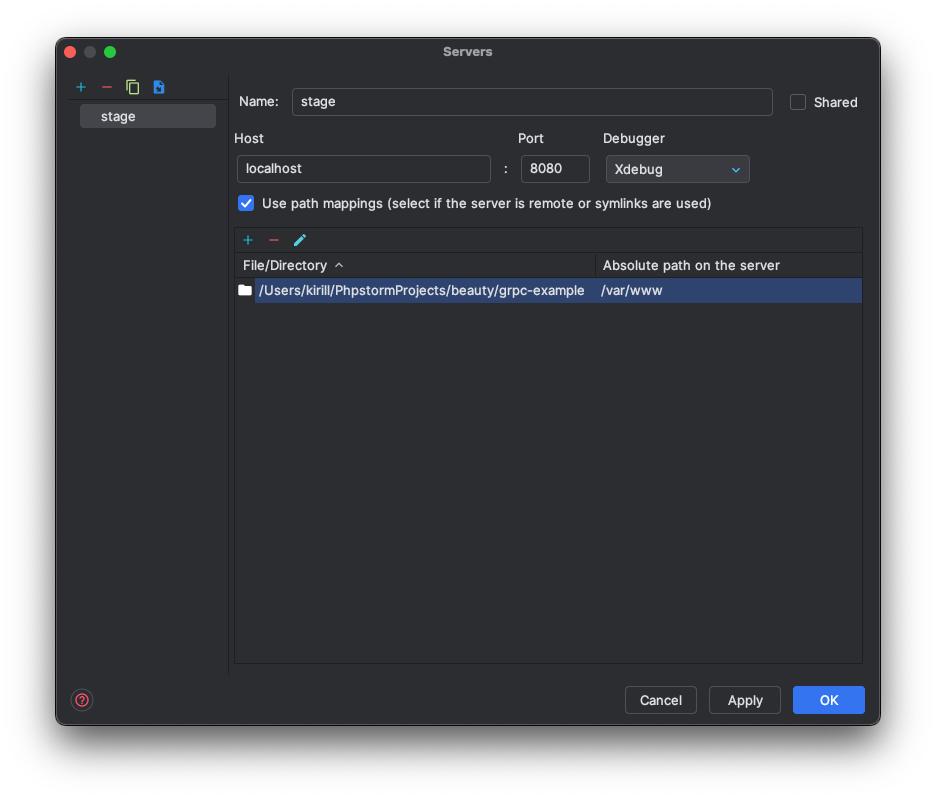
Preferences → PHP → Servers
- Name:
stage - Host:
localhost - Port:
8080(or80, depending on your RR/HTTP setup) - Path Mappings: map
/var/wwwto your local project path
- Name:
-
Preferences → PHP → Debug
- Debug port:
9003 - Enable: "Start Listening for PHP Debug Connections"
- Debug port:
-
Set a breakpoint and launch your application using
make upor./vendor/bin/rr serve
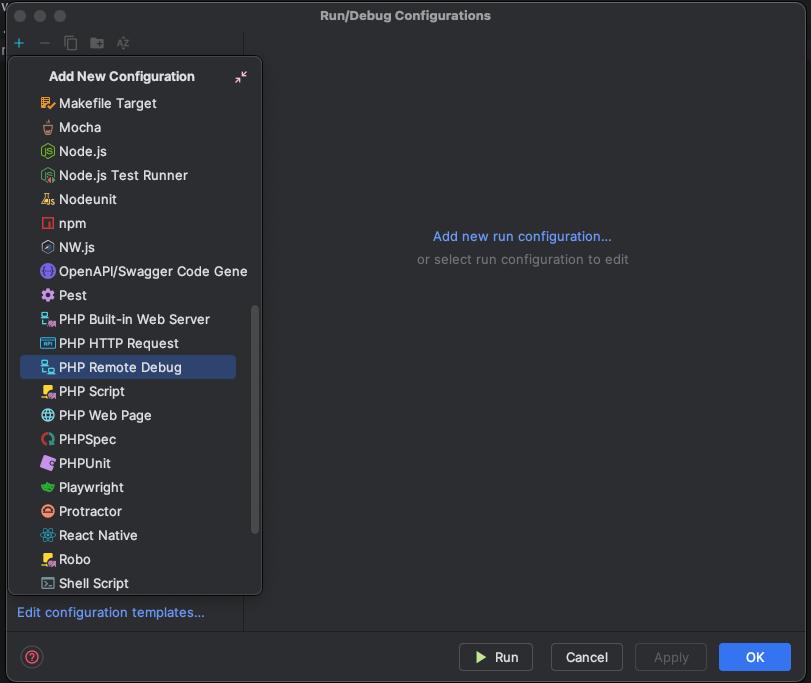
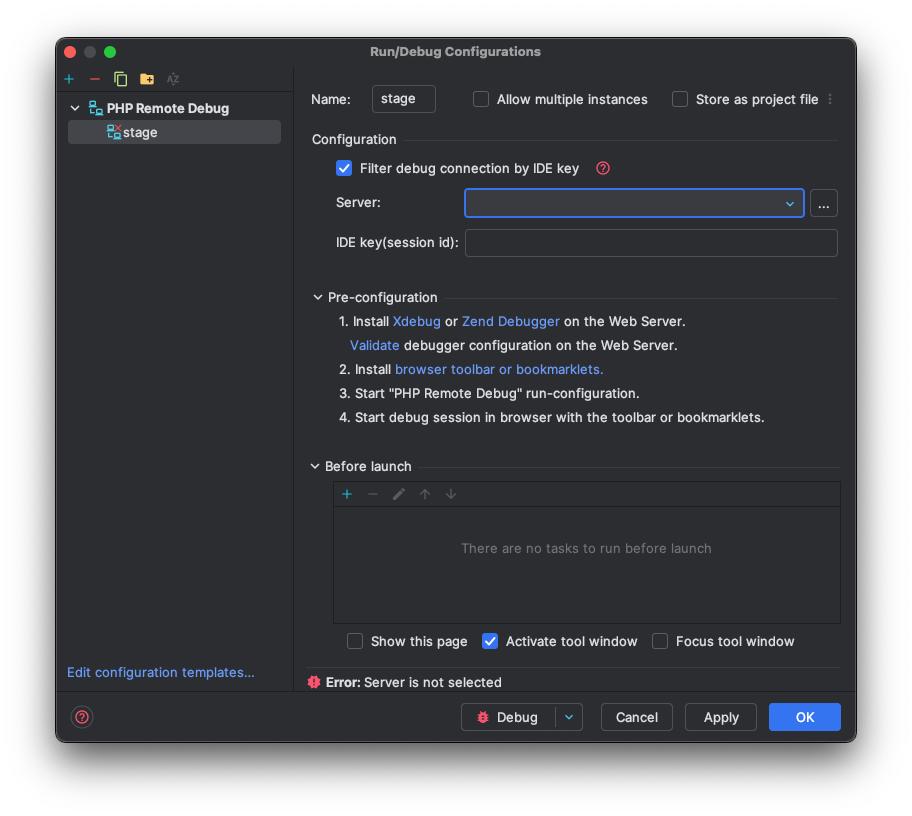
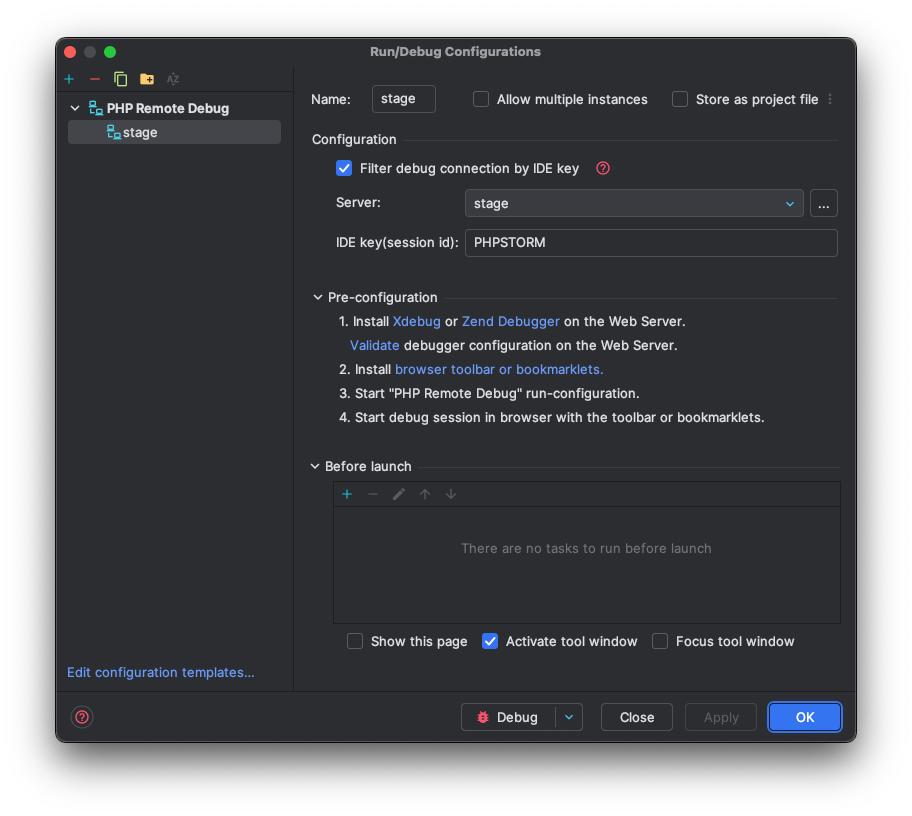
xDebug config screens

![]()
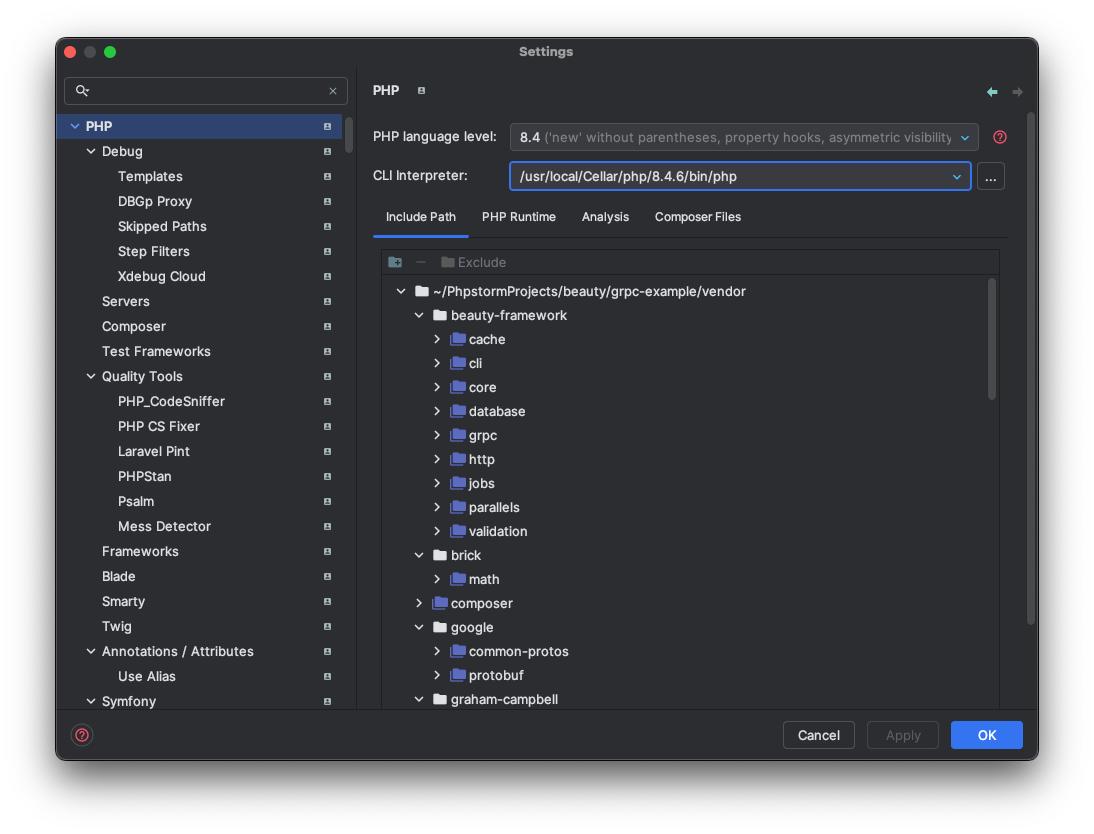
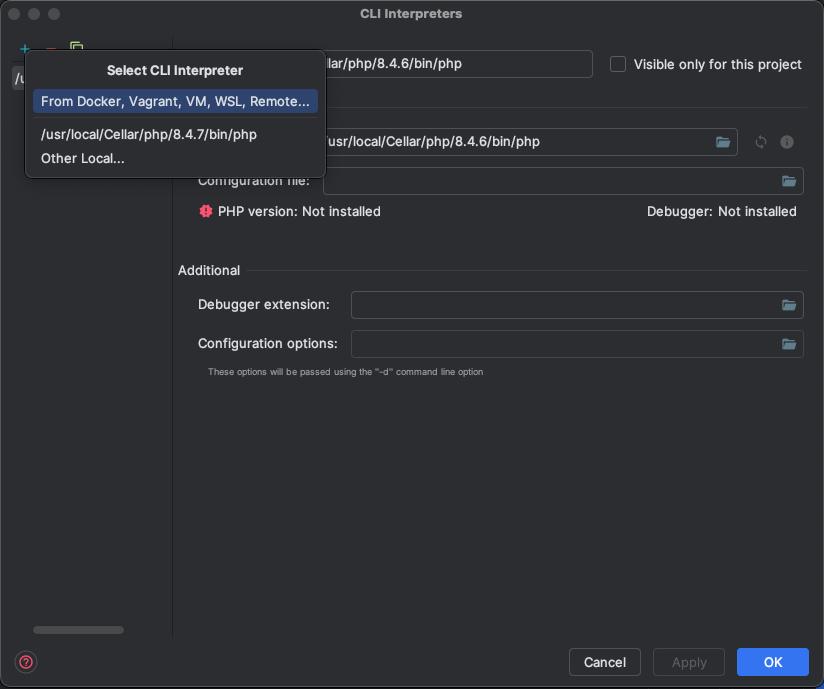
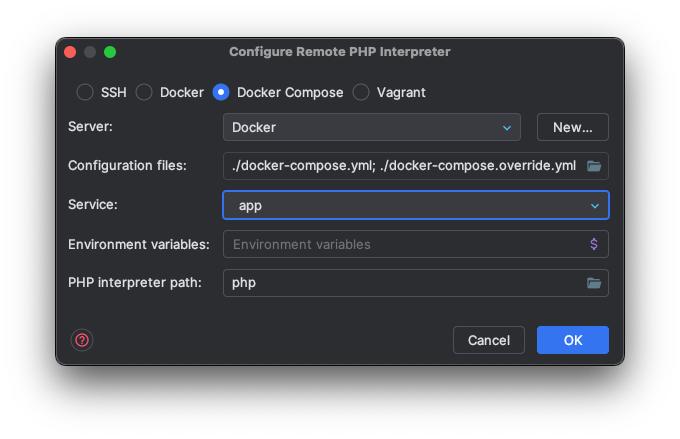
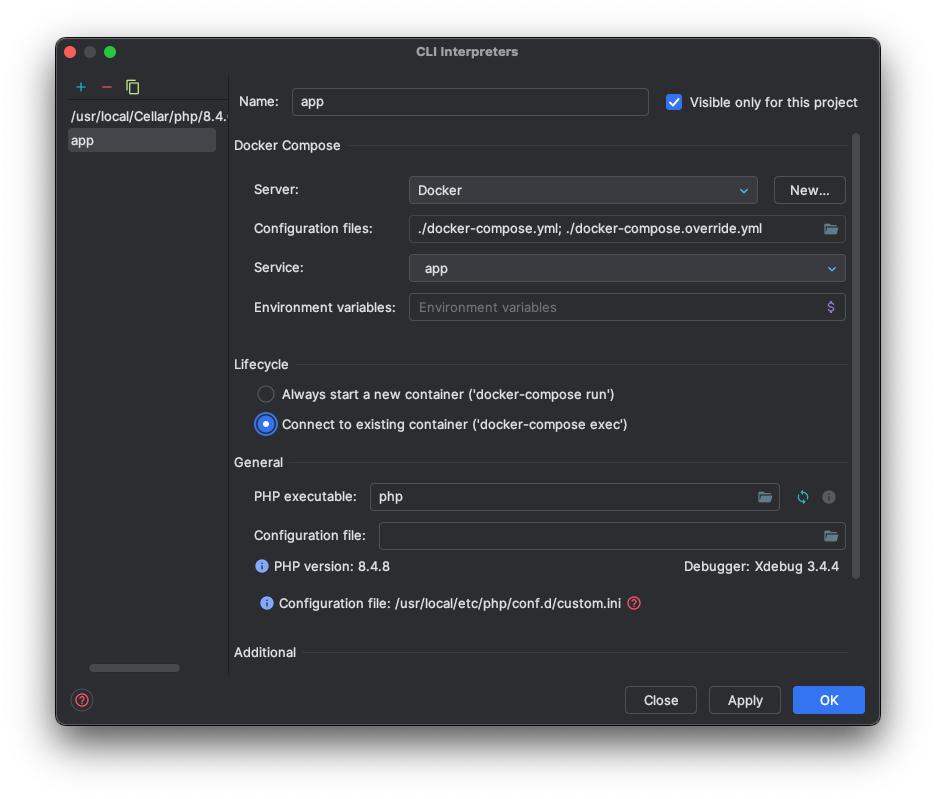
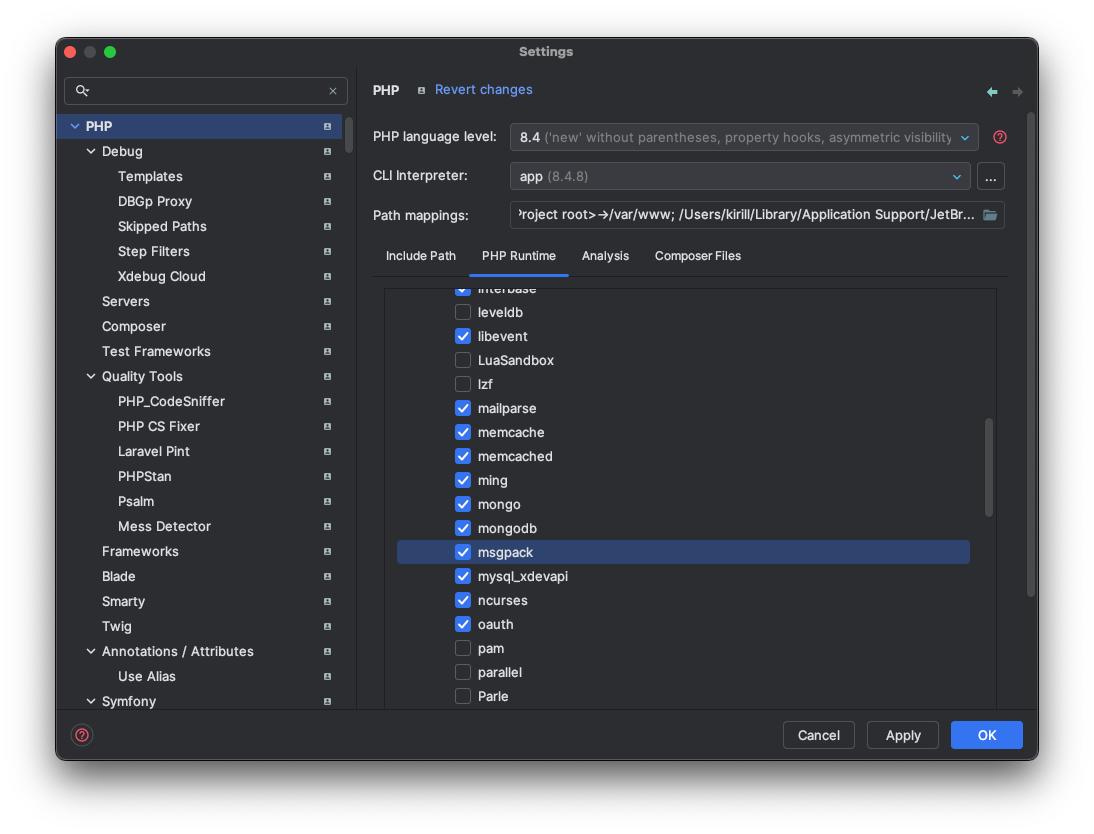
PHP Interpreter config screens
✅ Testing
Open your app in the browser and trigger a route that hits a breakpoint. PhpStorm should automatically pause execution and open the debugger panel.